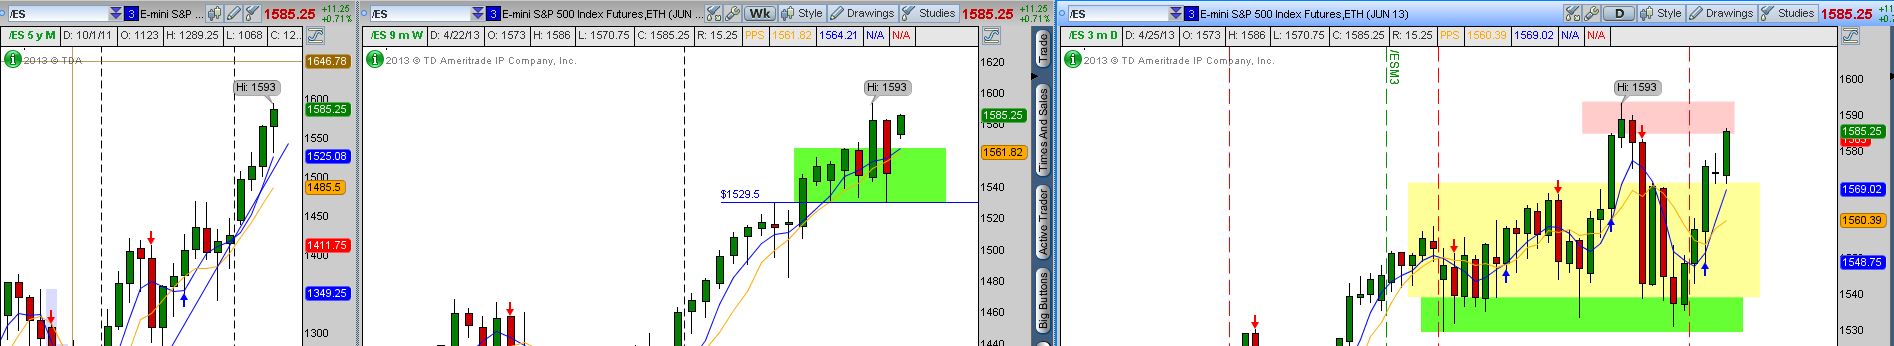
 I was asked a very good question last night at Albuquerque Market Traders MeetUp. Are you bullish or bearish on the overall market? See the above chart which is from left to right.. a monthly, Weekly and Daily of the /ES. This is the mini future of the S&P 500. I like to evaluate the monthly before I look at the weekly, the weekly before looking at the daily and so on. Looking at the monthly chart we are in a nice parabolic up trend. The weekly is in an up trend with a minor pause the last six weeks. The daily looks more sideways however it has bounced three times off of its support. Now we are approaching the resistance area which is on the daily chart above in red. If we get a close above this. I will look for the price to pull back to the top of the box, testing what was resistance which now will become support. If this happens we will be back into blue sky. So I am as I said last night bullish monthly, bullish weekly and bullish to neutral daily.
Swing4it.com
Option Traders

