
Looks like the S&P wants to get to 1593 again. Watching it closely.
Category Archives: Daily Analysis
$ES Bullish Bearish Neutral ??
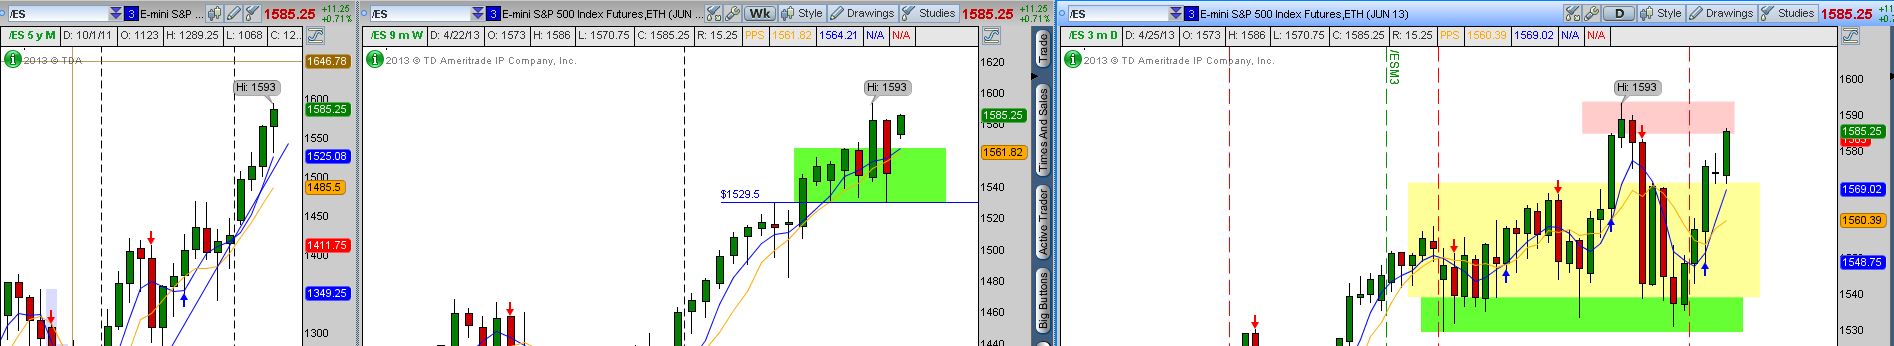 I was asked a very good question last night at Albuquerque Market Traders MeetUp. Are you bullish or bearish on the overall market? See the above chart which is from left to right.. a monthly, Weekly and Daily of the /ES. This is the mini future of the S&P 500. I like to evaluate the monthly before I look at the weekly, the weekly before looking at the daily and so on. Looking at the monthly chart we are in a nice parabolic up trend. The weekly is in an up trend with a minor pause the last six weeks. The daily looks more sideways however it has bounced three times off of its support. Now we are approaching the resistance area which is on the daily chart above in red. If we get a close above this. I will look for the price to pull back to the top of the box, testing what was resistance which now will become support. If this happens we will be back into blue sky. So I am as I said last night bullish monthly, bullish weekly and bullish to neutral daily.
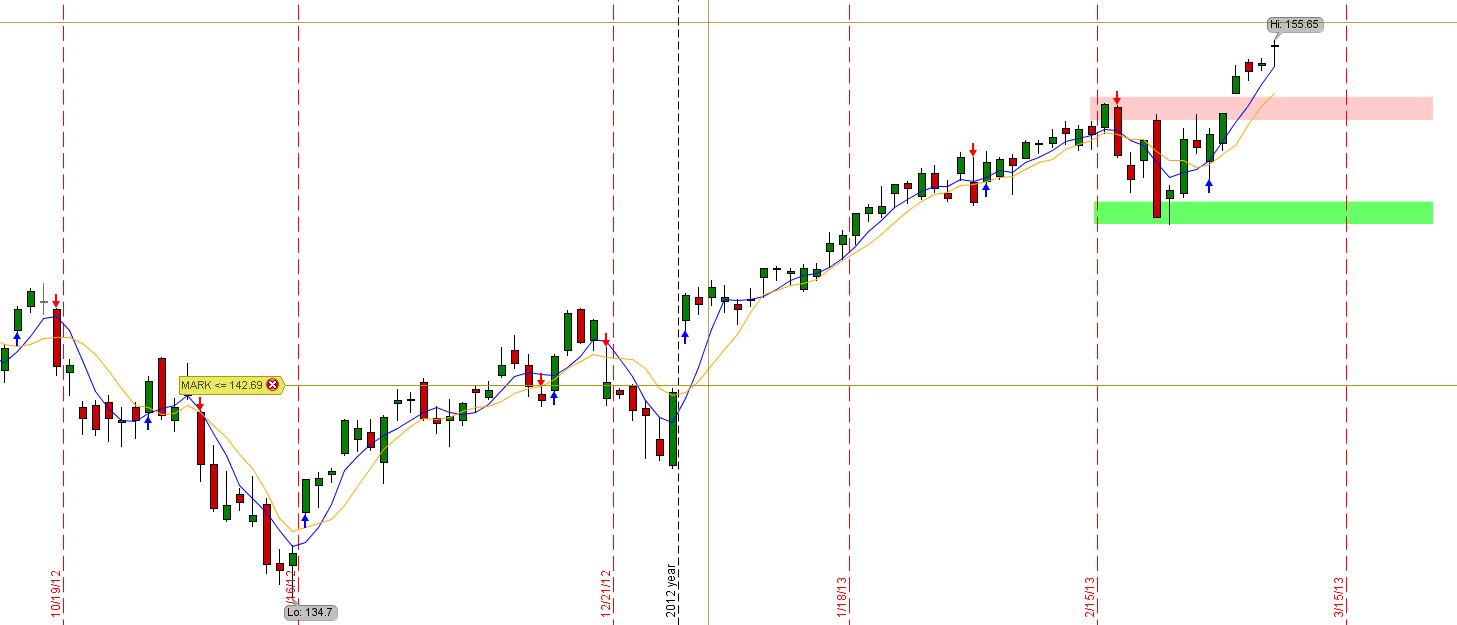
IN THE ZONE $ES
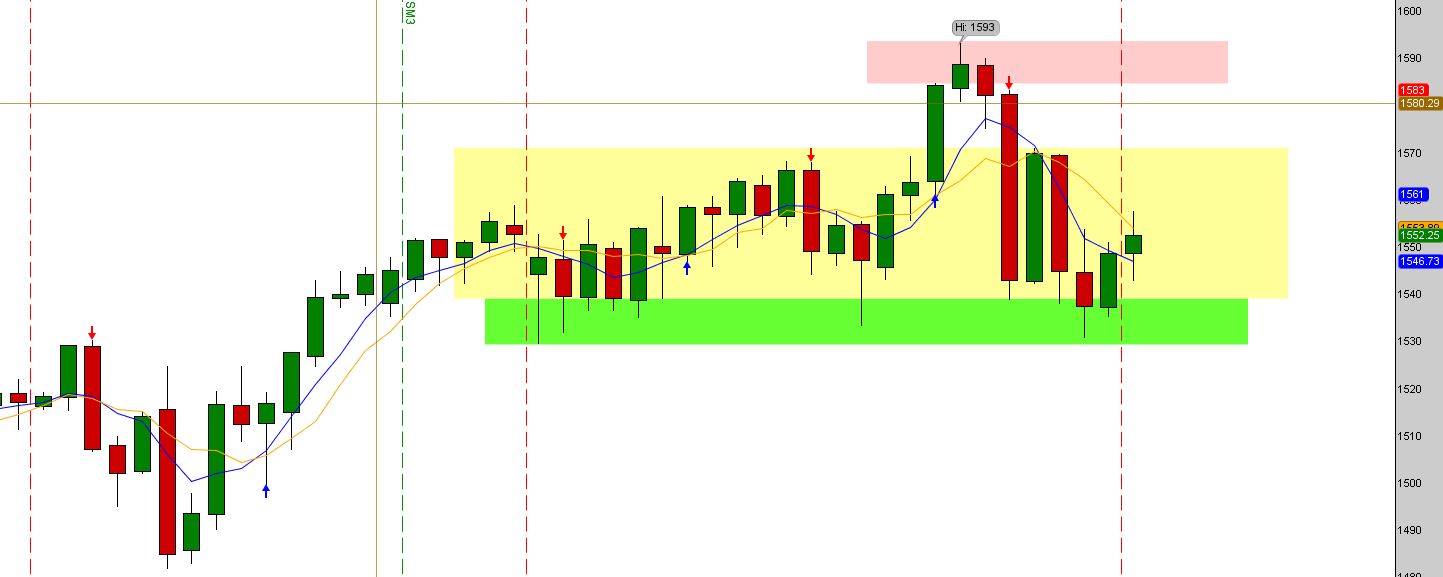 We are in the zone. The yellow area is a consolidation area that we tried to break week before last. Problem is we just came right back into the ZONE. You can see how the support area (green) is holding up. We may try and form a head and shoulders pattern. Can you see it left shoulder, head and right shoulder may be forming. Critical resistance is at the top of the yellow box. Happy Trading!!
Bulls Spanking the Bears
 Here is an update to my post this weekend. New highs that keep coming. Bears are getting spanked. Every day we are trading into blue sky so who knows where this stalls. Sure enjoying the ride.
Bullish Now LOL
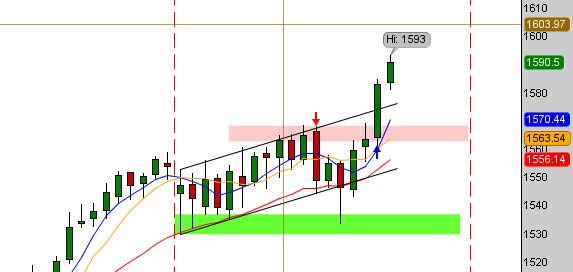
Now we are trading above the top of the channel I drew this weekend. The hammer played out perfectly. Gotta Love it.
Cautiously Bullish
 Looking at this chart the green box is my support and the red box is my resistance. Also the channel lines you see are holding support. With the employment report coming in this week worse than expected the market had an initial sell off. At the end of the day the buyers stepped in and brought this back into the channel. The candle pattern is a hammer which is one of the best turn around candle patterns.
I am going to be watching the 1555.50 area to see if it holds resistance. If we close back up here I expect to see the uptrend continue. If we break and close below 1525 then get ready to start loading up on the short side. In summary this is a tough area and be careful. Long Term Bullish, Mid Term Bullish and Short Term Bearish. Happy Trading.
SPY Consolidation??
 We might find a consolidation channel up here for a bit. If we break in either direction we should see a nice move. I am really curios what is going to come of this Cyprus banking / Euro / Russia situation. We have the Russians and EU meeting tomorrow and Friday. I think the Russians are pretty upset about what the EU is trying to accomplish. Think about this for a minute… You have your money safely tucked away in the bank and the governing bodies decide to tax what you have. Maybe we can get the fed to print some money and bail out Cyprus. Sure is entertaining.
Unemployment Good but not Good Enough….What about this Doji?
 Here is the deal. The unemployment report was good enough to make everyone feel warm and fuzzy. However it is not good enough to get the Fed to slow down the money machine. Traders understand that as long as the Fed is stimulating the market things are bullish. We should get a pull back soon but nothing like we saw in 2008. I just want to see the volatility continue.
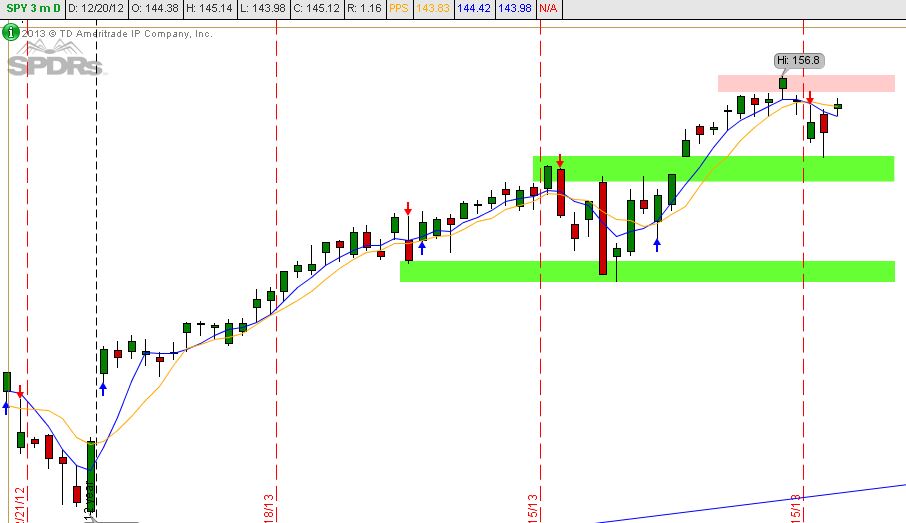
Chart Read: The doji from Friday could be a sign that we are going to see a pull back. Doji candles are a sign of indecision. I am watching Monday for a possible move below the low of this doji which will give us confirmation that we are going to see the pull back. The high from Friday will act as resistance. If we break this top then who knows where we will find resistance. No buyers we are coming down. This is the higher odds. Monday I want to see price at resistance and get a strong pattern signaling down. If price is sitting on the pivot or S1 then I will be careful to go long. Happy Trading…
Yoga…. Market is Stretched
This is making the Market very flexible. OK so now that we have the new high out of the way maybe we can get a snap. I am looking to get short in the next few days for swing trades. We shall see what the market gives. Follow the rules. Today was a great example of rules making money.
My Friend Butch Blog Post
This is a post from one of my mentors in the market. Enjoy! http://www.personsplanet.com/blog/es-support-and-resistance-for-342013/
