Wacky markets /ES 200MA

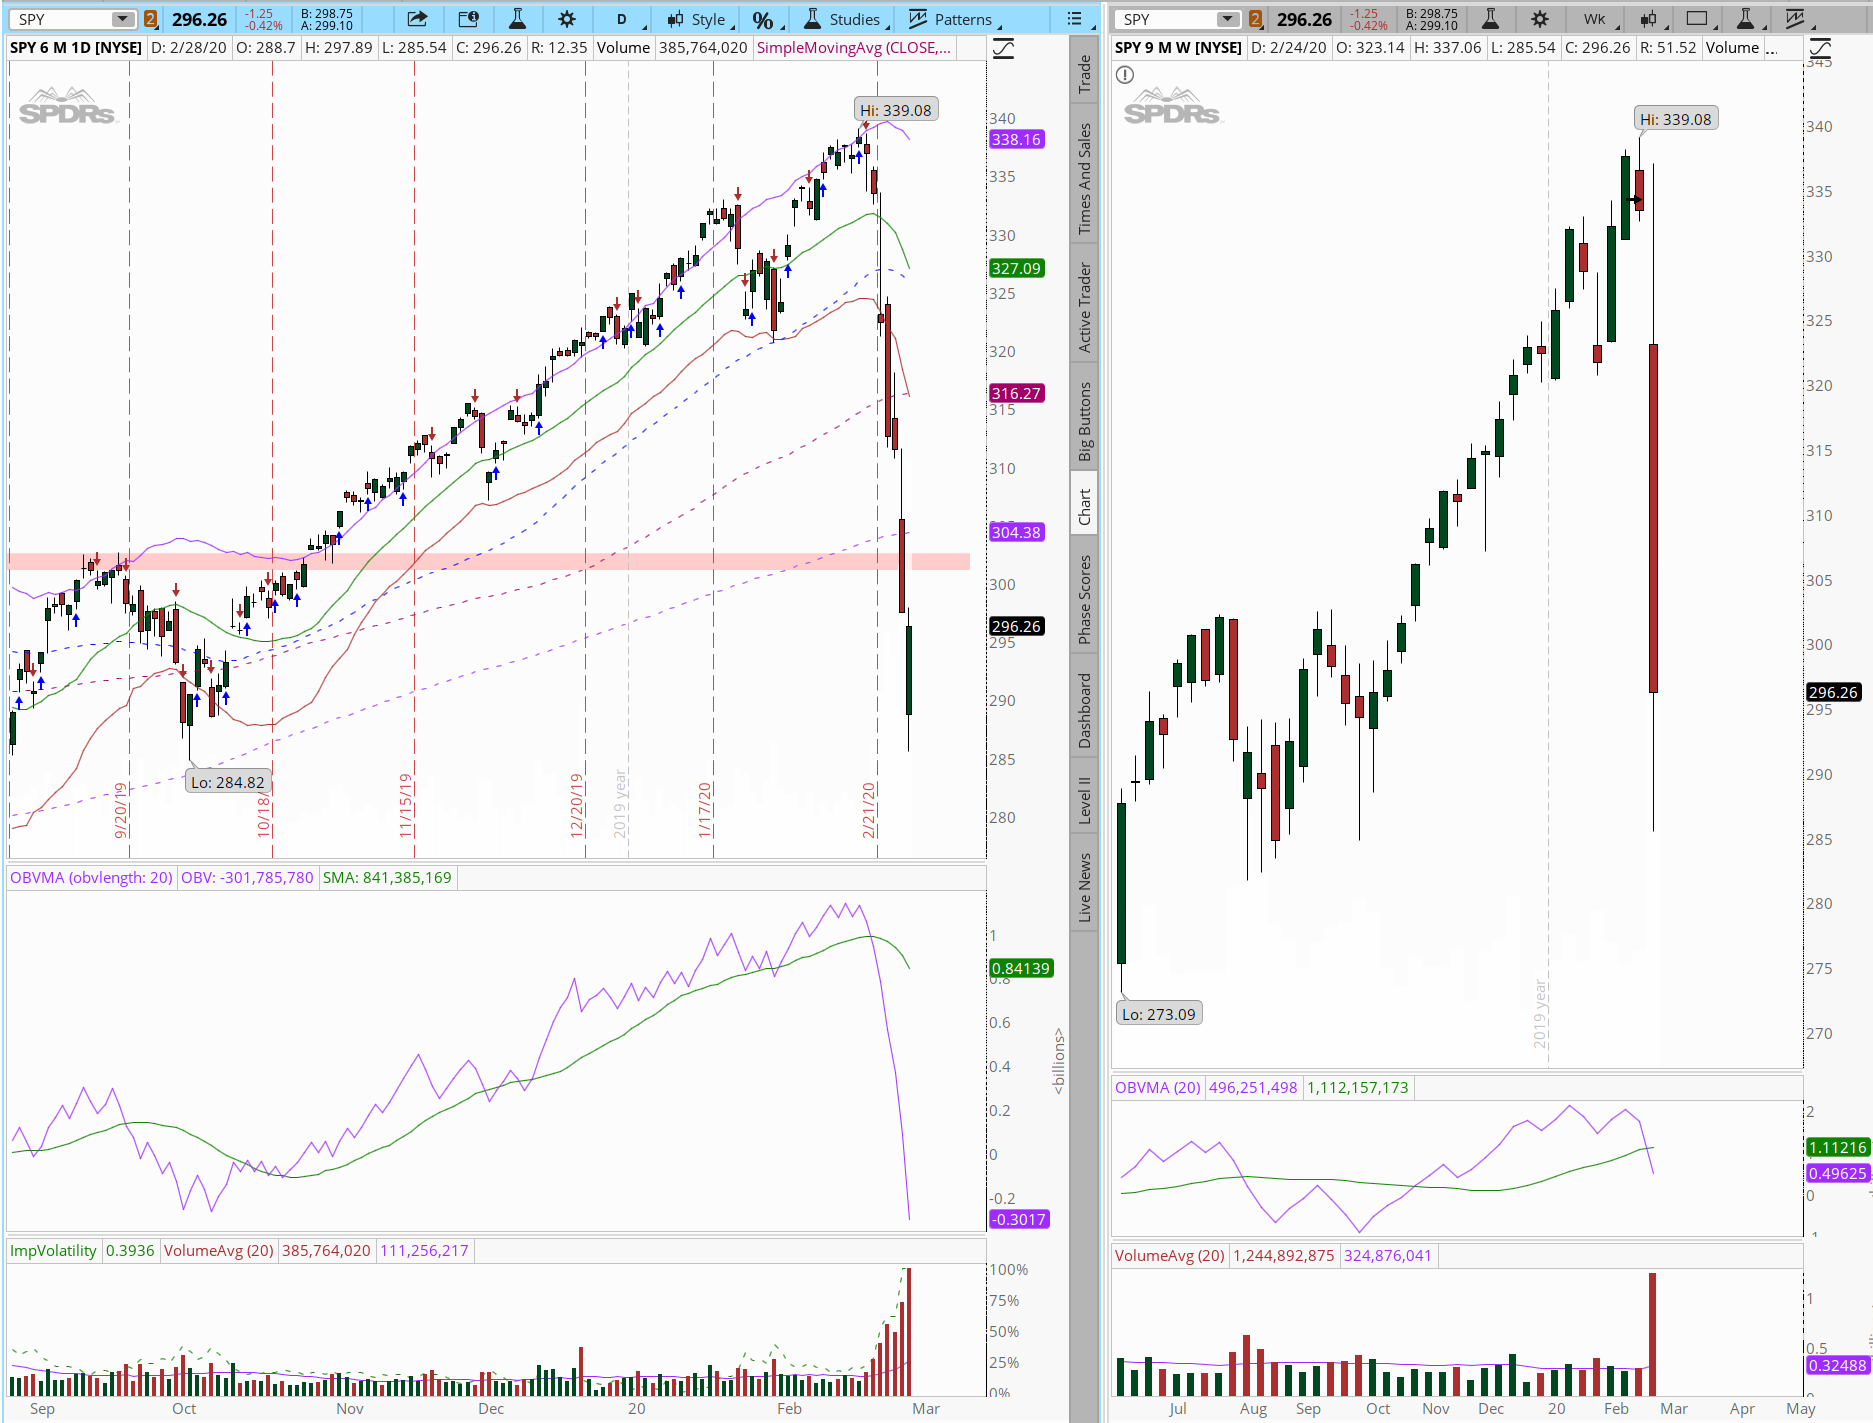
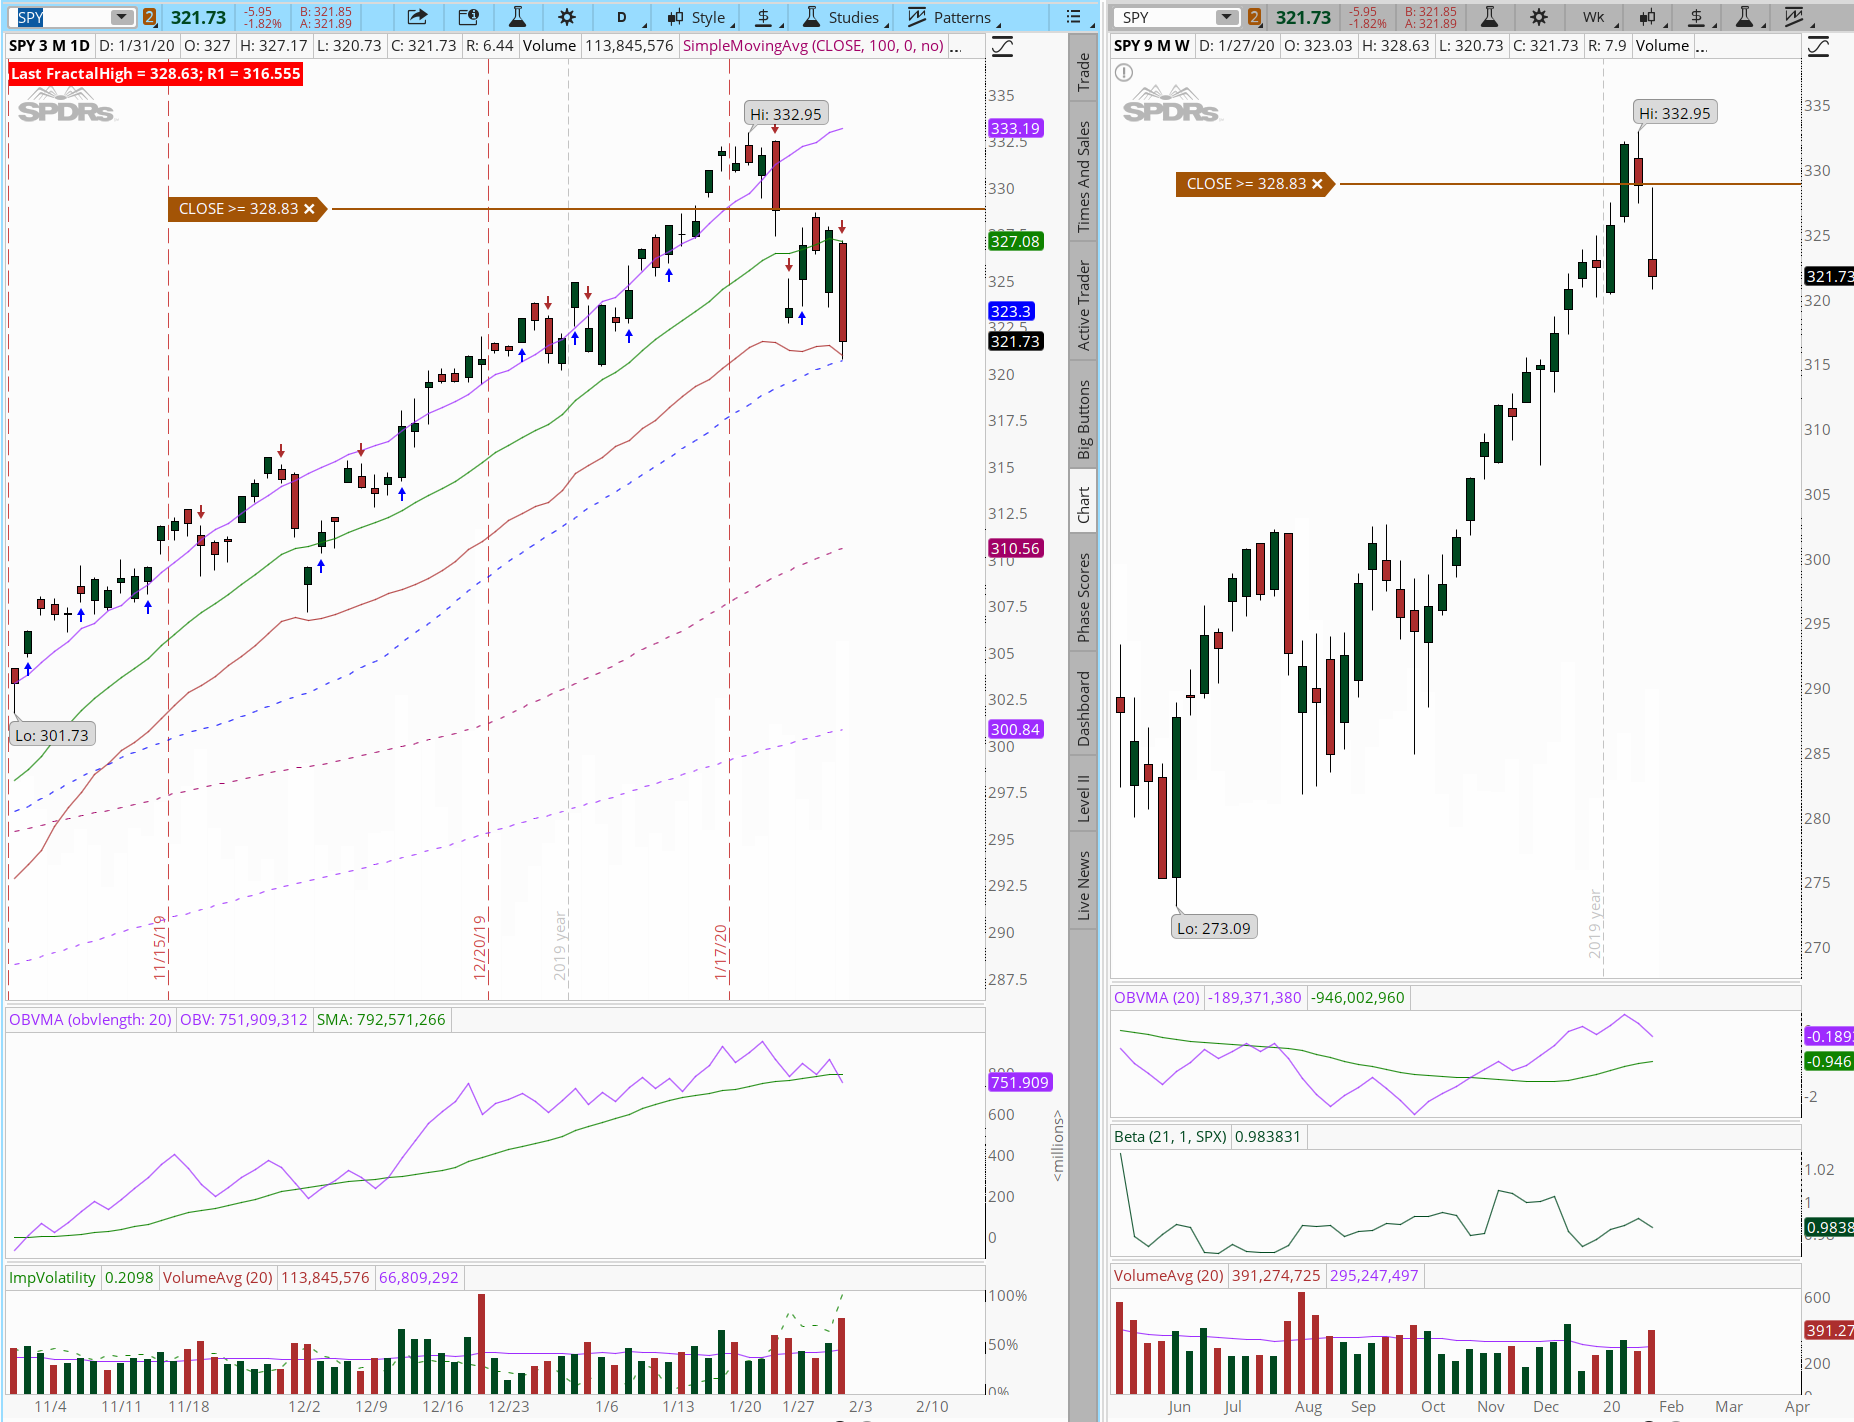
Looks like our political system is still in tac. The market loves the result TODAY. This is a market that can and will bite us so be very careful. I am still looking for a short signal (Close Below the Low of the High) on the Daily chart. Yesterdays candle is the driving candle at this time.

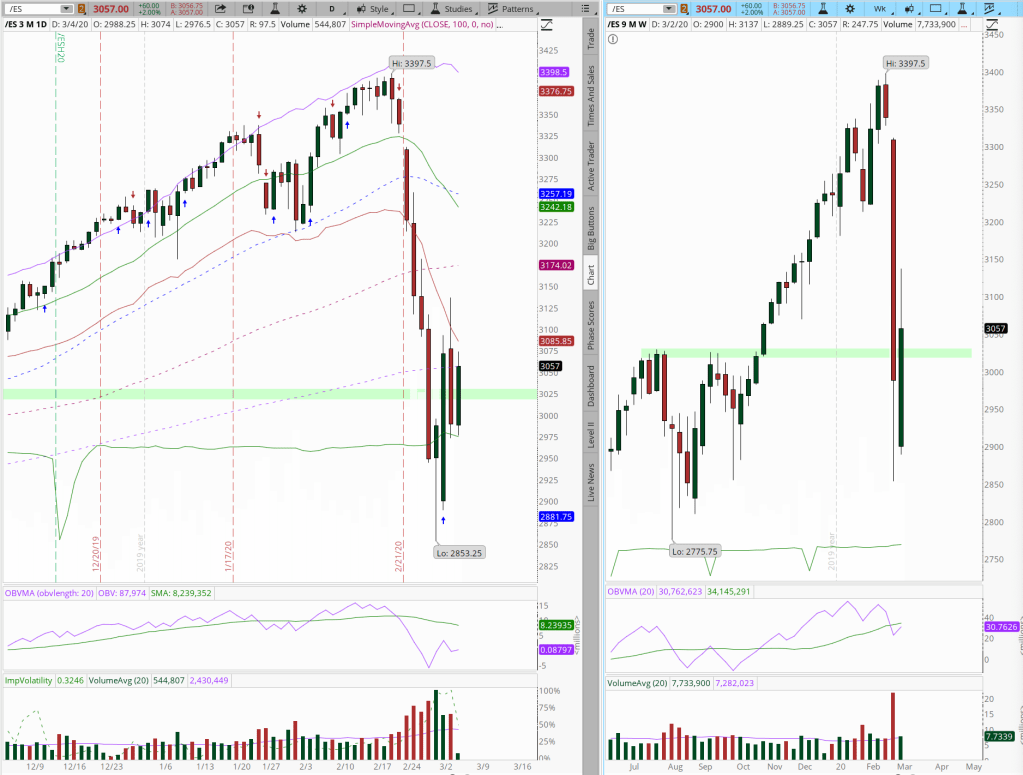
The challenge I am having is last weeks weekly candle. It is the low in the market and for it to be taken out we need to see it close above its high and that is just an amazing move. The other scenario which is more likely is for it to make a new low. This is the camp I am in today. Give this some time and it will fix. Today I am looking at the 200MA to see if it stays bearish.

SPY Daily and Weekly Trend Down

Screen Shot 2020-02-28 at 8.33.59 PM

Make sure to read my post about the XLF. Everything happened the same this week for the SPY except I am out of all positions at this time. You can see on the chart the resistance I have drawn. This is close to the 200 MA and will be the attraction next week. We will have to see if it makes it through this area. What I will be looking for is a SHORT SIGNAL (Close Below the Low of the High) on the daily chart. The weekly chart is jacked at this point. I do expect this to stay wacky.

WOWZA When will it stop bleeding? 200MA is close!

I was asked what my results have been with the Surfer Trade today by a friend. After this week this quarter finally came around. My performance for the portfolio is as follows Quarter 3 2019 was 20.13%, Quarter 4 was only 6.5% and this Quarter so far is around 20%. I will see better results going forward due to the changes I made early last month. Also I will keep improving the quality of this site. So stay tuned and LET’S MAKE SOME MONEY!!!!!

SPY Trend is Weekly Up Daily Down

Screen Shot 2020-02-22 at 6.40.49 AM

We had a close below the Trailing Stop. So the trade reverses to the short side. I have closed the Calendar and the Long call. I am now in a 70 delta Put. Open position is a 3/20/2020 expire 341 put for 9.17. This looks to me like a top is starting to form. The last top formed around 1/22/2020 and is being tested now. The pull back tested the 38.2 fib level so let’s see if it holds. Fed is saying they are going to let off the accelerator here real soon. We have the Corona Virus spreading outside of China. Hang on this may get interesting.

XLF $2,604.92 -18.06%

Screen Shot 2020-02-22 at 6.42.10 AM

These transition periods in the markets are rough on this trading system. This trade was looking good until Friday. The action all week was pretty wacky. Thursday sure looked like it was a bounce. Then Friday opened up and just ran down. Per the rules of this trade. There is a close below the Trailing Stop so we closed the Calendar and the long call and purchased a short put 70 delta. See below

Closed

Sold 6 each 3/20/2020 30 Puts at .34

Bought back 6 each 3/20/2020 31 Calls at 1.11

Bought back 6 each 2/21/2020 31 Puts at .29

Opened

Bought 8 3/20/2020 31 Puts at .70

SPY Trend Up started last week

Screen Shot 2020-02-15 at 6.59.35 AM

Weekly chart closed above the high of the low last week which predicted a really strong move this last week. The daily chart is acting like a normal up trend as well. Trailing stop is 334.52 today. I rolled the 332.00 to the 337.00 for next weeks expire. My calendar protection is 323.00 for a 3/20/2020 expire. Then along side this trade I have a Long Call which I bought last week 322.00 for 13.57 and it is trading at 17.66 currently. I have a larger account that I am running this trade in btw.

Rough Week Switch to XLF $2,721.29 -15.2%

Screen Shot 2020-02-09 at 6.59.57 AM

Above is a picture of the SPY. I am switching to the SPY because I lost more than I should have this week due to the SPY having more risk than the portfolio allows. By switching to the XLF I am able to manage this account correctly according to my rules. I will post a chart of the XLF on a weekly basis as well as this chart just to keep tracking them together.

Lost a little $3,279.80 +1.5%

Screen Shot 2020-01-31 at 6.02.59 PM

We have Coronavirus scare coming on this week. Oil is tanking and the Fed is creating more dollars. Bearish, Bearish and Bullish. I was short at the start of the week. Tuesday I received a signal to get out of the short position. Then today Friday I saw the market moving down with lots of weakness. I went ahead and placed a surfer trade short and was able to scale half before the end of the day.

Early today 10:30 our time

Buy 2 Feb 21 323 Put 4.77                                  Scale half 5.67

Buy 2 Feb 21 332 Call 1.10                                  Scale half .90

Sell 2 Feb 21 323 Call 5.48                                  Scale half 4.85


SPY Weakness…$3,490.00 and 7.4%

Screen Shot 2020-01-28 at 6.48.14 AM

Friday’s close on the daily chart indicated to get short the SPY (Conditional Change 329.27). I had rolled the Calendar trade I was doing earlier that morning and then closed it so I was hit with dat trading rules. I am conducting an experiment to take a small account of $3,250.00 and see how much we can pull in a year. So far the account has increased $240.00 which is a 7.4% increase.

Current Trade:

Feb 18 2020 328 Call 1 Contract Sell $5.08

Feb 18 2020 328 Put 1 Contract Buy $3.89

Feb 18 2020 337 Call 1 Contract Buy $.31