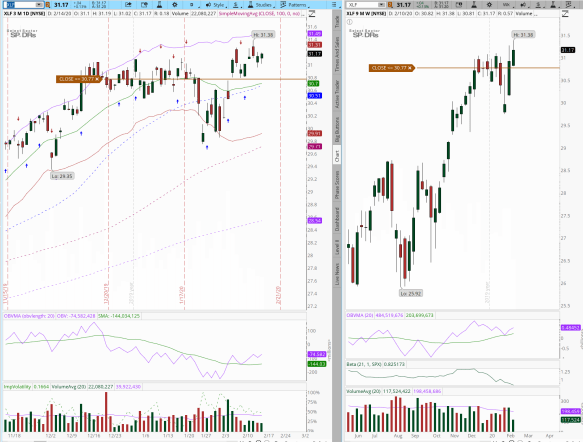
Trading got really crazy this week. The XLF which went down really hard as did the entire market made things really fun. I mentioned last Friday that things were going to get real interesting and I did get short the XLF. WHAT A WEEK!! I scaled half of the trade on Monday and a quarter Thursday. I then took another contract this morning leaving me with one contract. The rules at this point are to use skill to manage the last of the position. When I see a LONG SIGNAL (Close above the high of the Low) on the daily I will exit the current position. Looking forward things are going to stay wacky. The buying that came in at the end of today was pretty strong. I will be watching the $28.04 which is the 38.2% fib level and will more than likely be out of the trade I am in now. When I see a daily SHORT SIGNAL (Close Below the Low of the High) I will enter short again. Stay Tuned this is so much fun.
Category Archives: Uncategorized
WOWZA When will it stop bleeding? 200MA is close!
I was asked what my results have been with the Surfer Trade today by a friend. After this week this quarter finally came around. My performance for the portfolio is as follows Quarter 3 2019 was 20.13%, Quarter 4 was only 6.5% and this Quarter so far is around 20%. I will see better results going forward due to the changes I made early last month. Also I will keep improving the quality of this site. So stay tuned and LET’S MAKE SOME MONEY!!!!!
SPY Trend is Weekly Up Daily Down
We had a close below the Trailing Stop. So the trade reverses to the short side. I have closed the Calendar and the Long call. I am now in a 70 delta Put. Open position is a 3/20/2020 expire 341 put for 9.17. This looks to me like a top is starting to form. The last top formed around 1/22/2020 and is being tested now. The pull back tested the 38.2 fib level so let’s see if it holds. Fed is saying they are going to let off the accelerator here real soon. We have the Corona Virus spreading outside of China. Hang on this may get interesting.
XLF $2,866.29 -9.6%
Weekly Chart signaled last week. Close above the high of the low candle. Daily Chart is on the move up with the Trailing Stop at 30.77. I rolled the 31.00 and picked up a credit of .12 (.03 bought back and sold next week for .15) to next week and kept everything else the same.
SPY Trend Up started last week
Weekly chart closed above the high of the low last week which predicted a really strong move this last week. The daily chart is acting like a normal up trend as well. Trailing stop is 334.52 today. I rolled the 332.00 to the 337.00 for next weeks expire. My calendar protection is 323.00 for a 3/20/2020 expire. Then along side this trade I have a Long Call which I bought last week 322.00 for 13.57 and it is trading at 17.66 currently. I have a larger account that I am running this trade in btw.
XLF Trade $2,721.00 -15.2%
Weekly Chart Signal (CAHOL). Daily Chart stop is 30.42. Here is the trade
6 Contracts Calendar
Buy 3/20/2020 30 Put .38
Sell 2/14/2020 31 Put .33
6 Contracts Long Call (After meeting with Jim W. This is the same as a synthetic just much easier)
Buy 3/20/2020 30 Call 1.31
Rough Week Switch to XLF $2,721.29 -15.2%
Above is a picture of the SPY. I am switching to the SPY because I lost more than I should have this week due to the SPY having more risk than the portfolio allows. By switching to the XLF I am able to manage this account correctly according to my rules. I will post a chart of the XLF on a weekly basis as well as this chart just to keep tracking them together.
SPY Weakness…$3,490.00 and 7.4%
Friday’s close on the daily chart indicated to get short the SPY (Conditional Change 329.27). I had rolled the Calendar trade I was doing earlier that morning and then closed it so I was hit with dat trading rules. I am conducting an experiment to take a small account of $3,250.00 and see how much we can pull in a year. So far the account has increased $240.00 which is a 7.4% increase.
Current Trade:
Feb 18 2020 328 Call 1 Contract Sell $5.08
Feb 18 2020 328 Put 1 Contract Buy $3.89
Feb 18 2020 337 Call 1 Contract Buy $.31
Market Overview 11/19/2019
Starting with the /ES Bullish, /ZB Neutral to Bearish, /GC Neutral and /CL is Bearish.
Up up and Away
This is quite a push. Maybe now that QE mini is back we will see this continue. Remember to trade what you see. What I see is that we have new highs with on balance volume well above the average. Price up OBV up means strong positive delta trading. I will explain what this means soon in a video.